-
Notifications
You must be signed in to change notification settings - Fork 77
Home
Dan Rope edited this page Jun 14, 2016
·
29 revisions
Welcome to Brunel!
Brunel was created by Graham Wills and Dan Rope and is intended as a layer on top of low-level visualization technology that does not require programming to design compelling interactive visualizations. It is targeted at the data specialist (data scientist, data journalist) or anyone who wants to see their data in visual form rapidly and simply.
- Use the interactive [language tutorial] (http://brunel.mybluemix.net/docs/) or try it out online
- Check out the Brunel Visualization Cookbook
- Download the latest build
- Try Brunel via Python in IPython/Jupyter notebooks.
- Visit the Github Home and request [features or raise issues] (https://github.com/Brunel-Visualization/Brunel/issues)
- Read about the Project Structure and Build Details and look at the sample "Hello World" App
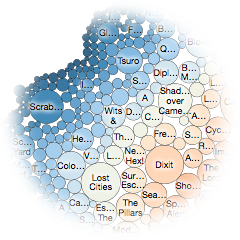
Click on any visualization of interest below to open up the online viewer and editor where you can see the results live, edit the chart, and grab some HTML to embed in your system:


