-
Notifications
You must be signed in to change notification settings - Fork 0
HaKafkaNet ships with a UI built with React and Bootstrap for gathering information about your currently running automations. You can enable/disable automations as well as get trace information.
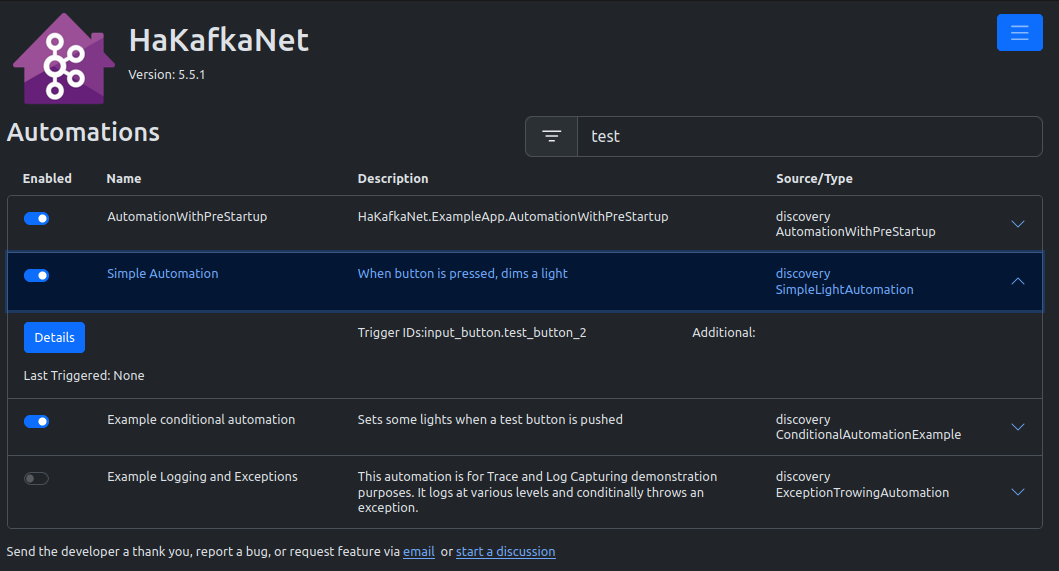
Here is a screenshot of the dashboard when using the example app.
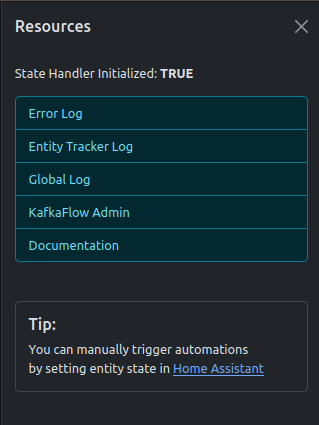
 Clicking the hamburger button in the upper right will open the menu.
The menu has the following links:
- Error Log - This will display all errors logged with a log level of warning or above.
- Entity Tracker Log - If you have the entity tracker enabled in your configuration, this will display any logs captured during its run.
- Global Log - Any logs not captured during an automation trace or associated with the entity tracker will be displayed.
- KafkaFlow Admin - A page provided by KafkaFlow to inspect consumers/producers in Kafka
- Documentation - A link to this documentation.
Above the links, the menu will display if the state handler is initialized. Sometimes, when restarting your application, it can take a minute for Kafkaflow to initialize. If you notice after a restart that events are not being handled, it is likely that this will display false. When the page loads, if the state handler is not initialized, the menu will open automatically and will check every 5 seconds until initialization has occurred.
Below the links is where you will find tips and/or additional information. At the moment, there is only one tip. More may be added in the future.
Below the header, the dashboard has a list of all your automations. Immediately above the list, an input field is provided to filter your list of automations. It will do a wildcard search on the following fields:
- Name
- Description
- Source
- Any entity IDs used for triggers
- Any entity IDs used for additional entities to track.
Below that is a list of all automations discovered by the framework. Each item is expandable by clicking on the automation's name. Each automation lists:
- Enabled - a switch to enable/disable the automation
- Name - The name specified by you via metadata or the name of the type your automation if not specified.
- Description - The description specified by you, otherwise the Full Name of the type.
- Source - The source of the automation. If you implemented a custom automation and did not decorate it with the
ExludeFromDiscoveryattribute, the framework will initialize a singleton instance of your automation and display "Discovered" in this column. Otherwise, it will display the name of the registry from where the automation was registered. Trigger IDs - a list of entity IDs as returned by theTriggerEntityIds()method of the automation. - Type - The type of your automation. If you do not specify a name, these 2 columns will display the same information.
Click the "Details" button to navigate to the Automation Details page.
The automation details page has 2 sections. The top lists detailed Information about your automation. Several of the fields are described above. In addition, the following fields are listed:
- Key Request - Each automation is given a unique key. If you do not specify the key, a unique key will be generated. The key is used for
- The url of the details page
- Mapping trace information
- Enabling/disabling the automation
- Given Key - This is the actual key given to the automation based on what was requested. The request is cleaned to make sure it is url friendly and unique.
- Event Timings - The event timings your automation is using.
- Is Delayable - True if your automation is an
IConditionalAutomationorIDelayableAutomation, otherwise false
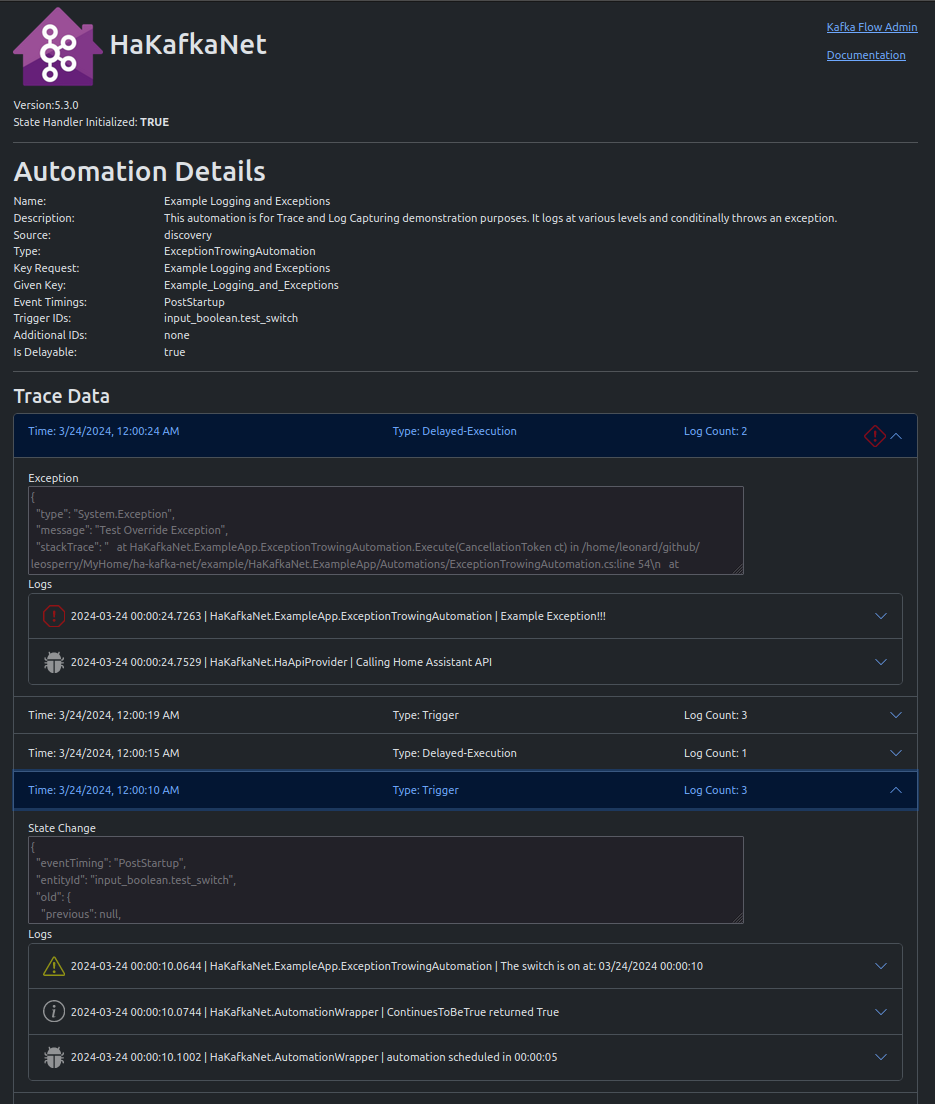
This is an image of the Automation Details page showing log capturing.
The bottom section of the page lists trace information from each time your automation ran. Traces are listed in reverse-chronological order of when they completed. Within each trace, if you have enabled log tracing, logs will be listed in chronological order.
There are 2 main types of trace: Trigger and Delayed-Execution. The latter will only appear if your automation is delayable as described above.
Trigger automations will also display the state change as sent by Home Assistant and recorded by the framework.
If your automation is delayable, the last log entries for Trigger traces will show what ContinuesToBeTrue() returned, and if it returned true, information about when you automation is scheduled to run.
If a method of your automation called by the UI throws an exception, or if you log an exception and have log capturing turn on, the header of the trace will display an icon indicating there was an exception and the exception will be shown above the log entries.

