-
-
Notifications
You must be signed in to change notification settings - Fork 3.7k
New issue
Have a question about this project? Sign up for a free GitHub account to open an issue and contact its maintainers and the community.
By clicking “Sign up for GitHub”, you agree to our terms of service and privacy statement. We’ll occasionally send you account related emails.
Already on GitHub? Sign in to your account
[Merged by Bors] - Add trace_tracy feature for Tracy profiling #2832
Conversation
There was a problem hiding this comment.
Choose a reason for hiding this comment
The reason will be displayed to describe this comment to others. Learn more.
Makes sense to me
It's unclear why tracing-tracy and tracing-chrome are mutually exclusive.
There was a problem hiding this comment.
Choose a reason for hiding this comment
The reason will be displayed to describe this comment to others. Learn more.
Could you also document the new feature in https://github.com/bevyengine/bevy/blob/main/docs/cargo_features.md
|
also some sort of doc on tracing could be useful but can be done in another pr |
Done.
Once I have used it a bit more I will write something as a quick start guide, but Tracy has a pretty comprehensive pdf documentation that ships with each release, so I would probably defer to that. |
There was a problem hiding this comment.
Choose a reason for hiding this comment
The reason will be displayed to describe this comment to others. Learn more.
Maybe consider updating https://github.com/bevyengine/bevy/blob/main/docs/profiling.md
|
If people are interested to see how I've been using this, you can check out the Visibility culling thread in #rendering-dev on Discord. Basically looking at mean system execution times to understand how much of an improvement frustum culling was producing, and in which systems. It's great for getting more of that sort of engineering feel for how the engine 'sounds'. :) It lead to me learning some stuff about how vsync seems to misbehave on macOS too. |
This could use an overhaul in general. Imo we shouldn't recommend thread_profiler anymore when we have |
|
Imo we should do that separately. |
|
bors r+ |
# Objective [Tracy](https://github.com/wolfpld/tracy) is: > A real time, nanosecond resolution, remote telemetry, hybrid frame and sampling profiler for games and other applications. With the `trace_tracy` feature enabled, you run your bevy app and either a headless server (`capture`) or a live, interactive profiler UI (`Tracy`), and connect that to your bevy application to then stream the metric data and events, and save it or inspect it live/offline. Previously when I implemented the spans across systems and stages and I was trying out different profiling tools, Tracy was too unstable on macOS to use. But now, quite some months later, it is working stably with Tracy 0.7.8. You can see timelines, aggregate statistics of mean system/stage execution times, and much more. It's very useful! 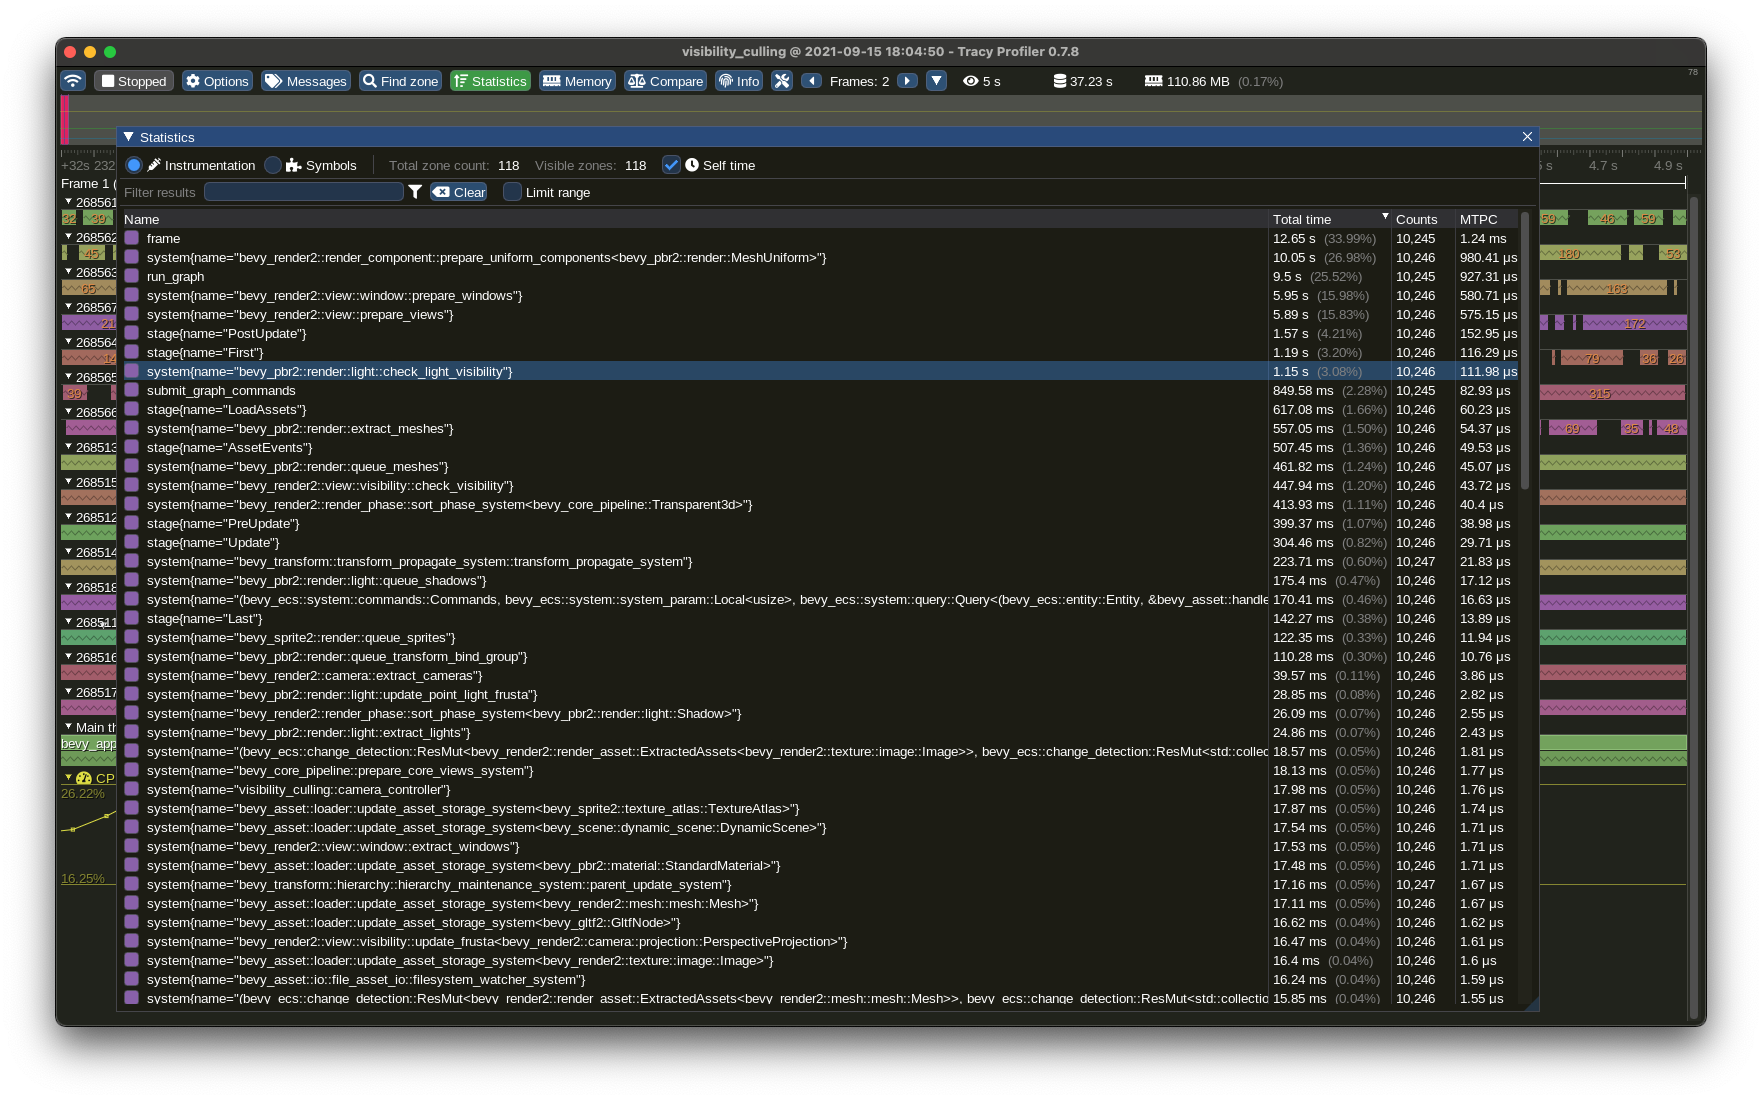 ## Solution - Use the `tracing-tracy` crate which supports our tracing spans - Expose via the non-default feature `trace_tracy` for consistency with other `trace*` features
|
Build failed (retrying...): |
# Objective [Tracy](https://github.com/wolfpld/tracy) is: > A real time, nanosecond resolution, remote telemetry, hybrid frame and sampling profiler for games and other applications. With the `trace_tracy` feature enabled, you run your bevy app and either a headless server (`capture`) or a live, interactive profiler UI (`Tracy`), and connect that to your bevy application to then stream the metric data and events, and save it or inspect it live/offline. Previously when I implemented the spans across systems and stages and I was trying out different profiling tools, Tracy was too unstable on macOS to use. But now, quite some months later, it is working stably with Tracy 0.7.8. You can see timelines, aggregate statistics of mean system/stage execution times, and much more. It's very useful!  ## Solution - Use the `tracing-tracy` crate which supports our tracing spans - Expose via the non-default feature `trace_tracy` for consistency with other `trace*` features
[Tracy](https://github.com/wolfpld/tracy) is: > A real time, nanosecond resolution, remote telemetry, hybrid frame and sampling profiler for games and other applications. With the `trace_tracy` feature enabled, you run your bevy app and either a headless server (`capture`) or a live, interactive profiler UI (`Tracy`), and connect that to your bevy application to then stream the metric data and events, and save it or inspect it live/offline. Previously when I implemented the spans across systems and stages and I was trying out different profiling tools, Tracy was too unstable on macOS to use. But now, quite some months later, it is working stably with Tracy 0.7.8. You can see timelines, aggregate statistics of mean system/stage execution times, and much more. It's very useful!  - Use the `tracing-tracy` crate which supports our tracing spans - Expose via the non-default feature `trace_tracy` for consistency with other `trace*` features
[Tracy](https://github.com/wolfpld/tracy) is: > A real time, nanosecond resolution, remote telemetry, hybrid frame and sampling profiler for games and other applications. With the `trace_tracy` feature enabled, you run your bevy app and either a headless server (`capture`) or a live, interactive profiler UI (`Tracy`), and connect that to your bevy application to then stream the metric data and events, and save it or inspect it live/offline. Previously when I implemented the spans across systems and stages and I was trying out different profiling tools, Tracy was too unstable on macOS to use. But now, quite some months later, it is working stably with Tracy 0.7.8. You can see timelines, aggregate statistics of mean system/stage execution times, and much more. It's very useful!  - Use the `tracing-tracy` crate which supports our tracing spans - Expose via the non-default feature `trace_tracy` for consistency with other `trace*` features
[Tracy](https://github.com/wolfpld/tracy) is: > A real time, nanosecond resolution, remote telemetry, hybrid frame and sampling profiler for games and other applications. With the `trace_tracy` feature enabled, you run your bevy app and either a headless server (`capture`) or a live, interactive profiler UI (`Tracy`), and connect that to your bevy application to then stream the metric data and events, and save it or inspect it live/offline. Previously when I implemented the spans across systems and stages and I was trying out different profiling tools, Tracy was too unstable on macOS to use. But now, quite some months later, it is working stably with Tracy 0.7.8. You can see timelines, aggregate statistics of mean system/stage execution times, and much more. It's very useful!  - Use the `tracing-tracy` crate which supports our tracing spans - Expose via the non-default feature `trace_tracy` for consistency with other `trace*` features
Objective
Tracy is:
With the
trace_tracyfeature enabled, you run your bevy app and either a headless server (capture) or a live, interactive profiler UI (Tracy), and connect that to your bevy application to then stream the metric data and events, and save it or inspect it live/offline.Previously when I implemented the spans across systems and stages and I was trying out different profiling tools, Tracy was too unstable on macOS to use. But now, quite some months later, it is working stably with Tracy 0.7.8. You can see timelines, aggregate statistics of mean system/stage execution times, and much more. It's very useful!
Solution
tracing-tracycrate which supports our tracing spanstrace_tracyfor consistency with othertrace*features