A Textual widget wrapper for the Plotext plotting library.
The library makes one widget available: PlotextPlot. This widget provides
a plt property, which should be used where you would normally use plt as
seen in the Plotext documentation.
Let's take the first example from the Plotext README:
import plotext as plt
y = plt.sin() # sinusoidal test signal
plt.scatter(y)
plt.title("Scatter Plot") # to apply a title
plt.show() # to finally plot
The Textual equivalent of this (including everything needed to make this a fully-working Textual application) is:
from textual.app import App, ComposeResult

from textual_plotext import PlotextPlot

class ScatterApp(App[None]):

    def compose(self) -> ComposeResult:
        yield PlotextPlot()

    def on_mount(self) -> None:
        plt = self.query_one(PlotextPlot).plt
        y = plt.sin() # sinusoidal test signal
        plt.scatter(y)
        plt.title("Scatter Plot") # to apply a title

if __name__ == "__main__":
    ScatterApp().run()
The main differences to note are:
- We're not directly importing
plotext. - We use
PlotextPlot.pltrather thanplt. - We don't call Plotext's
showmethod,PlotextPlottakes care of this.
The library can be installed from PyPi:
$ pip install textual-plotextOnce installed you can quickly test the library by running the demo:
$ python -m textual_plotextThe demo app includes many of the examples shown in the Plotext README.
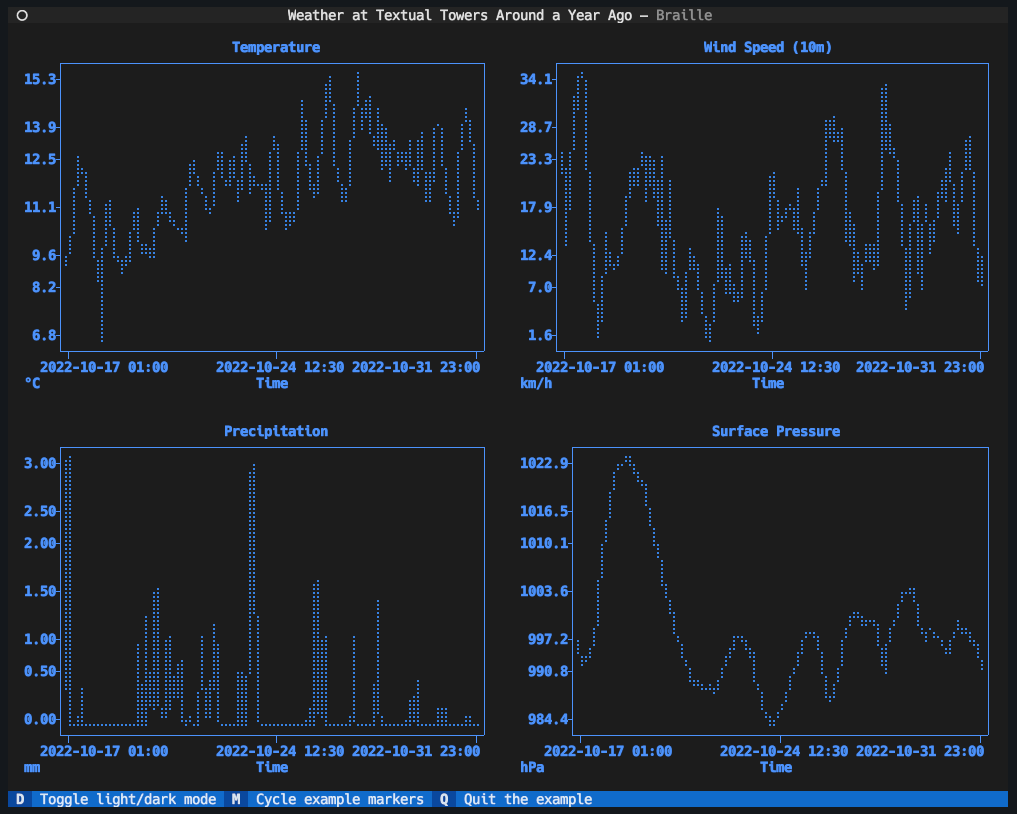
For a longer example of how to use the PlotextPlot widget, take a look at
examples/textual_towers_weather.py.
As a bonus it also shows an example of using Textual's worker
API to create a threaded
worker to pull
the data from the backend.
The following utility functions are provided (via PlotextPlot.plt):
plt.sinplt.squareplt.colorizeplt.uncolorize
Some functions are not supported at all; mainly those that would not make sense inside a Textual application. These include:
plt.interactiveplt.script_folderplt.parent_folderplt.join_pathsplt.save_textplt.read_dataplt.write_dataplt.downloadplt.delete_fileplt.testplt.timeplt.test_data_urlplt.test_bar_data_urlplt.test_image_urlplt.test_gif_urlplt.test_video_urlplt.test_youtube_url
The following properties and sub-modules also aren't exposed because they too are designed for REPL-based interactive use and don't lend themselves to being used in a Textual application:
plt.docplt.markersplt.colorsplt.stylesplt.themes
Also, currently, there is no support for GIF plots or playing videos; one or both could follow at some point in the future.
Some functions are supported as calls but are redefined to be non-operations; these are the sorts of code that wouldn't generally have a negative side-effect but which don't make sense for a Textual application. These include:
plt.clear_terminalplt.showplt.save_fig
Plotext has a system of
themes.
The themes provided by Plotext are supported by PlotextPlot. However, some
of those themes use "ANSI colors" and so may end up looking different
depending on which terminal you use, and what terminal theme is in use (if
your terminal supports themes); the issue here is that your plots may look
very different in different environments.
To help with this textual-plotext provides an additional set of copies of
those themes, all prefixed with textual-, that use full RGB coloring to
ensure that, when using a given Plotext theme, it will look the same
everywhere.
In addition to the Plotext themes, textual-plotext also adds two themes
called:
textual-design-darktextual-design-light
These are two similar themes designed to look good in dark mode and light
mode respectively. Out of the box, PlotextPlot will use these and will
switch between them when your Textual application switches between dark and
light mode. If
you wish to turn off this behaviour, simply set the auto_theme property of
your plot to False.
At the moment, due to what appears to be a bug in Plotext when it comes to
repeated calls to show or build1 for a plot with x or y scales set to
"log", it isn't possible to easily build such a plot. In other words, even
in the REPL with Plotext itself, a session such as this:
>>> import plotext as plt
>>> plt.xscale("log")
>>> plt.plot(plt.sin(periods=2, length=10**4))
>>> plt.show()
<plot is drawn in the terminal here>
>>> plt.show()
results in a ValueError: math domain error.
There is a workaround for this, which will work for Plotext use in general
and would also work nicely in a Textual app. After the first show or
build, set the problematic scale back to "linear". So the REPL session
should above would become:
>>> import plotext as plt
>>> plt.xscale("log")
>>> plt.plot(plt.sin(periods=2, length=10**4))
>>> plt.show()
<plot is drawn in the terminal here>
>>> plt.xscale("linear")     # Note this here!
>>> plt.show()
<plot is drawn in the terminal here>
>>> plt.show()
<plot is drawn in the terminal here>
etc...
In a Textual app, this would mean adding (assuming the xscale was the
problem here) this at the end of the code to create the plot:
_ = self.plt.build()
self.plt.xscale("linear")If you need help with this library, or with anything relating to Textual, feel free to come join the Textualize devs on Discord or the other places where we provide support.
Footnotes
-
Repeated calls to
buildwill happen when thePlottextPlotwidget needs torenderthe plot again, on resize for example. ↩
